

execute call. No sequential tool calls, no raw logs in the context window.
The Numbers
The agent even self-instrumented the timing with
Date.now() inside the sandbox.
The Code
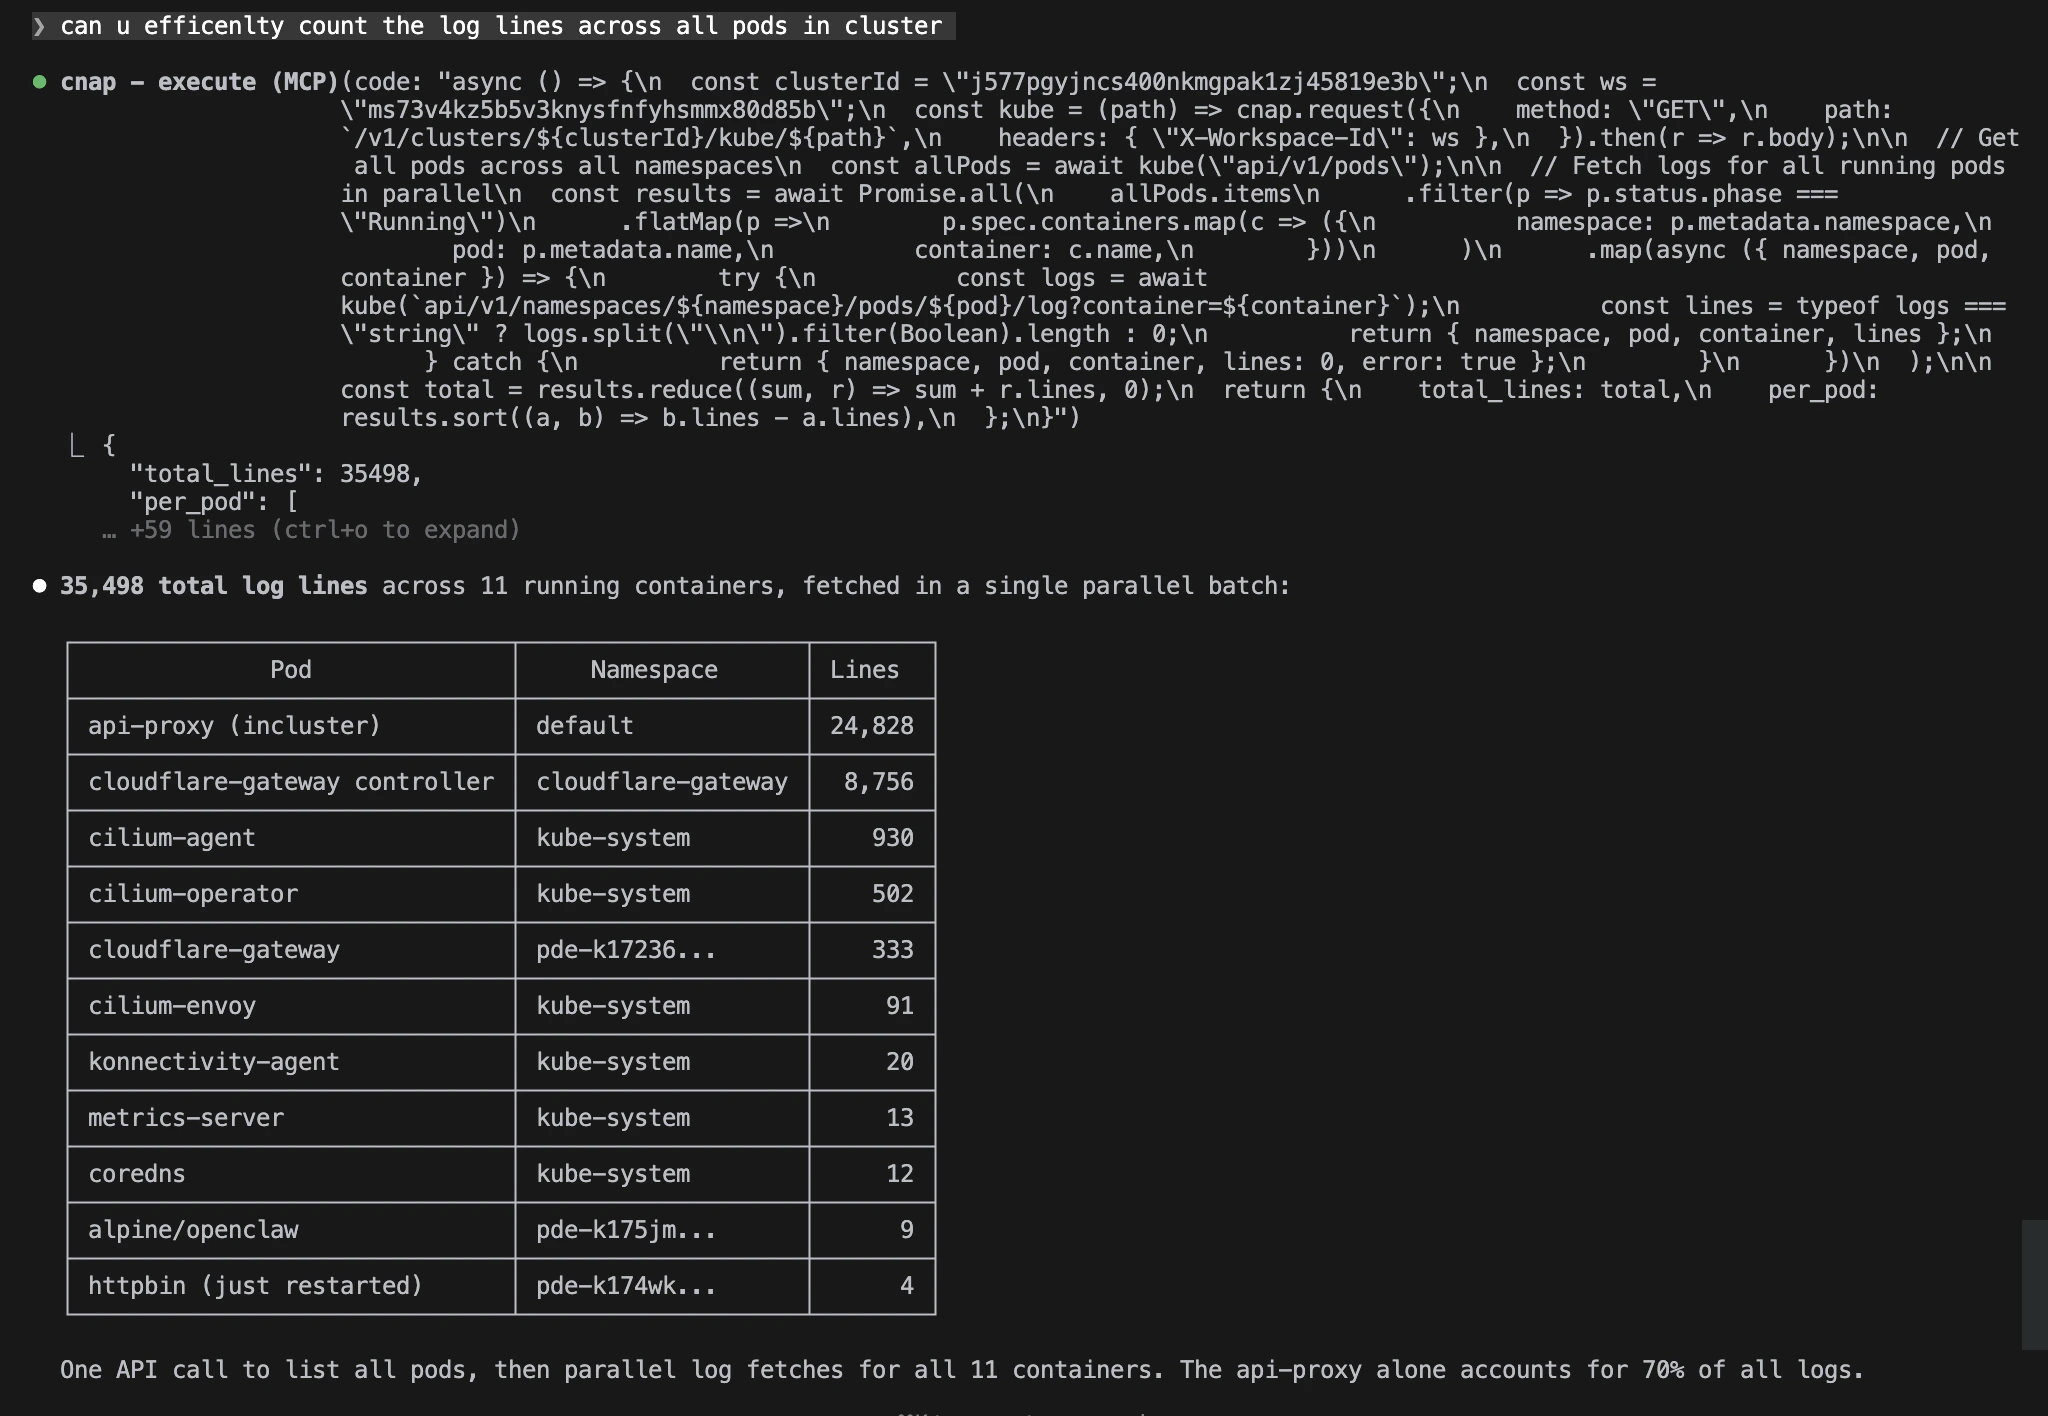
Why this matters
With traditional MCP tools, this would be 12+ sequential round trips: one to list pods, then one per container to fetch logs. Each round trip adds network latency, and every raw response gets dumped into the LLM’s context window. Code Mode does it in one tool call. The agent’s code filters, aggregates, and formats the data inside the sandbox before returning. Only the summary hits the context window, not 35,000 lines of raw logs.What the agent does
- Lists all pods across all namespaces
- Filters for running pods, expands to per-container list
- Fans out
Promise.all()across 11 log fetches in parallel - Counts lines per container, handles errors gracefully
- Sorts by line count, returns a clean summary
Related topics
Code Mode in action
More examples of the parallel fan-out pattern.
Incident debugging
Adaptive SRE triage: logs, events, rollout history.
Resource audit
Cluster-wide CPU and memory report in a single API call.
Kubernetes access
The kube proxy log endpoint used in this example.