> ## Documentation Index
> Fetch the complete documentation index at: https://docs.akua.dev/llms.txt
> Use this file to discover all available pages before exploring further.
# Parallel Log Analysis
> 35,000 log lines across 11 containers in 506ms, one tool call

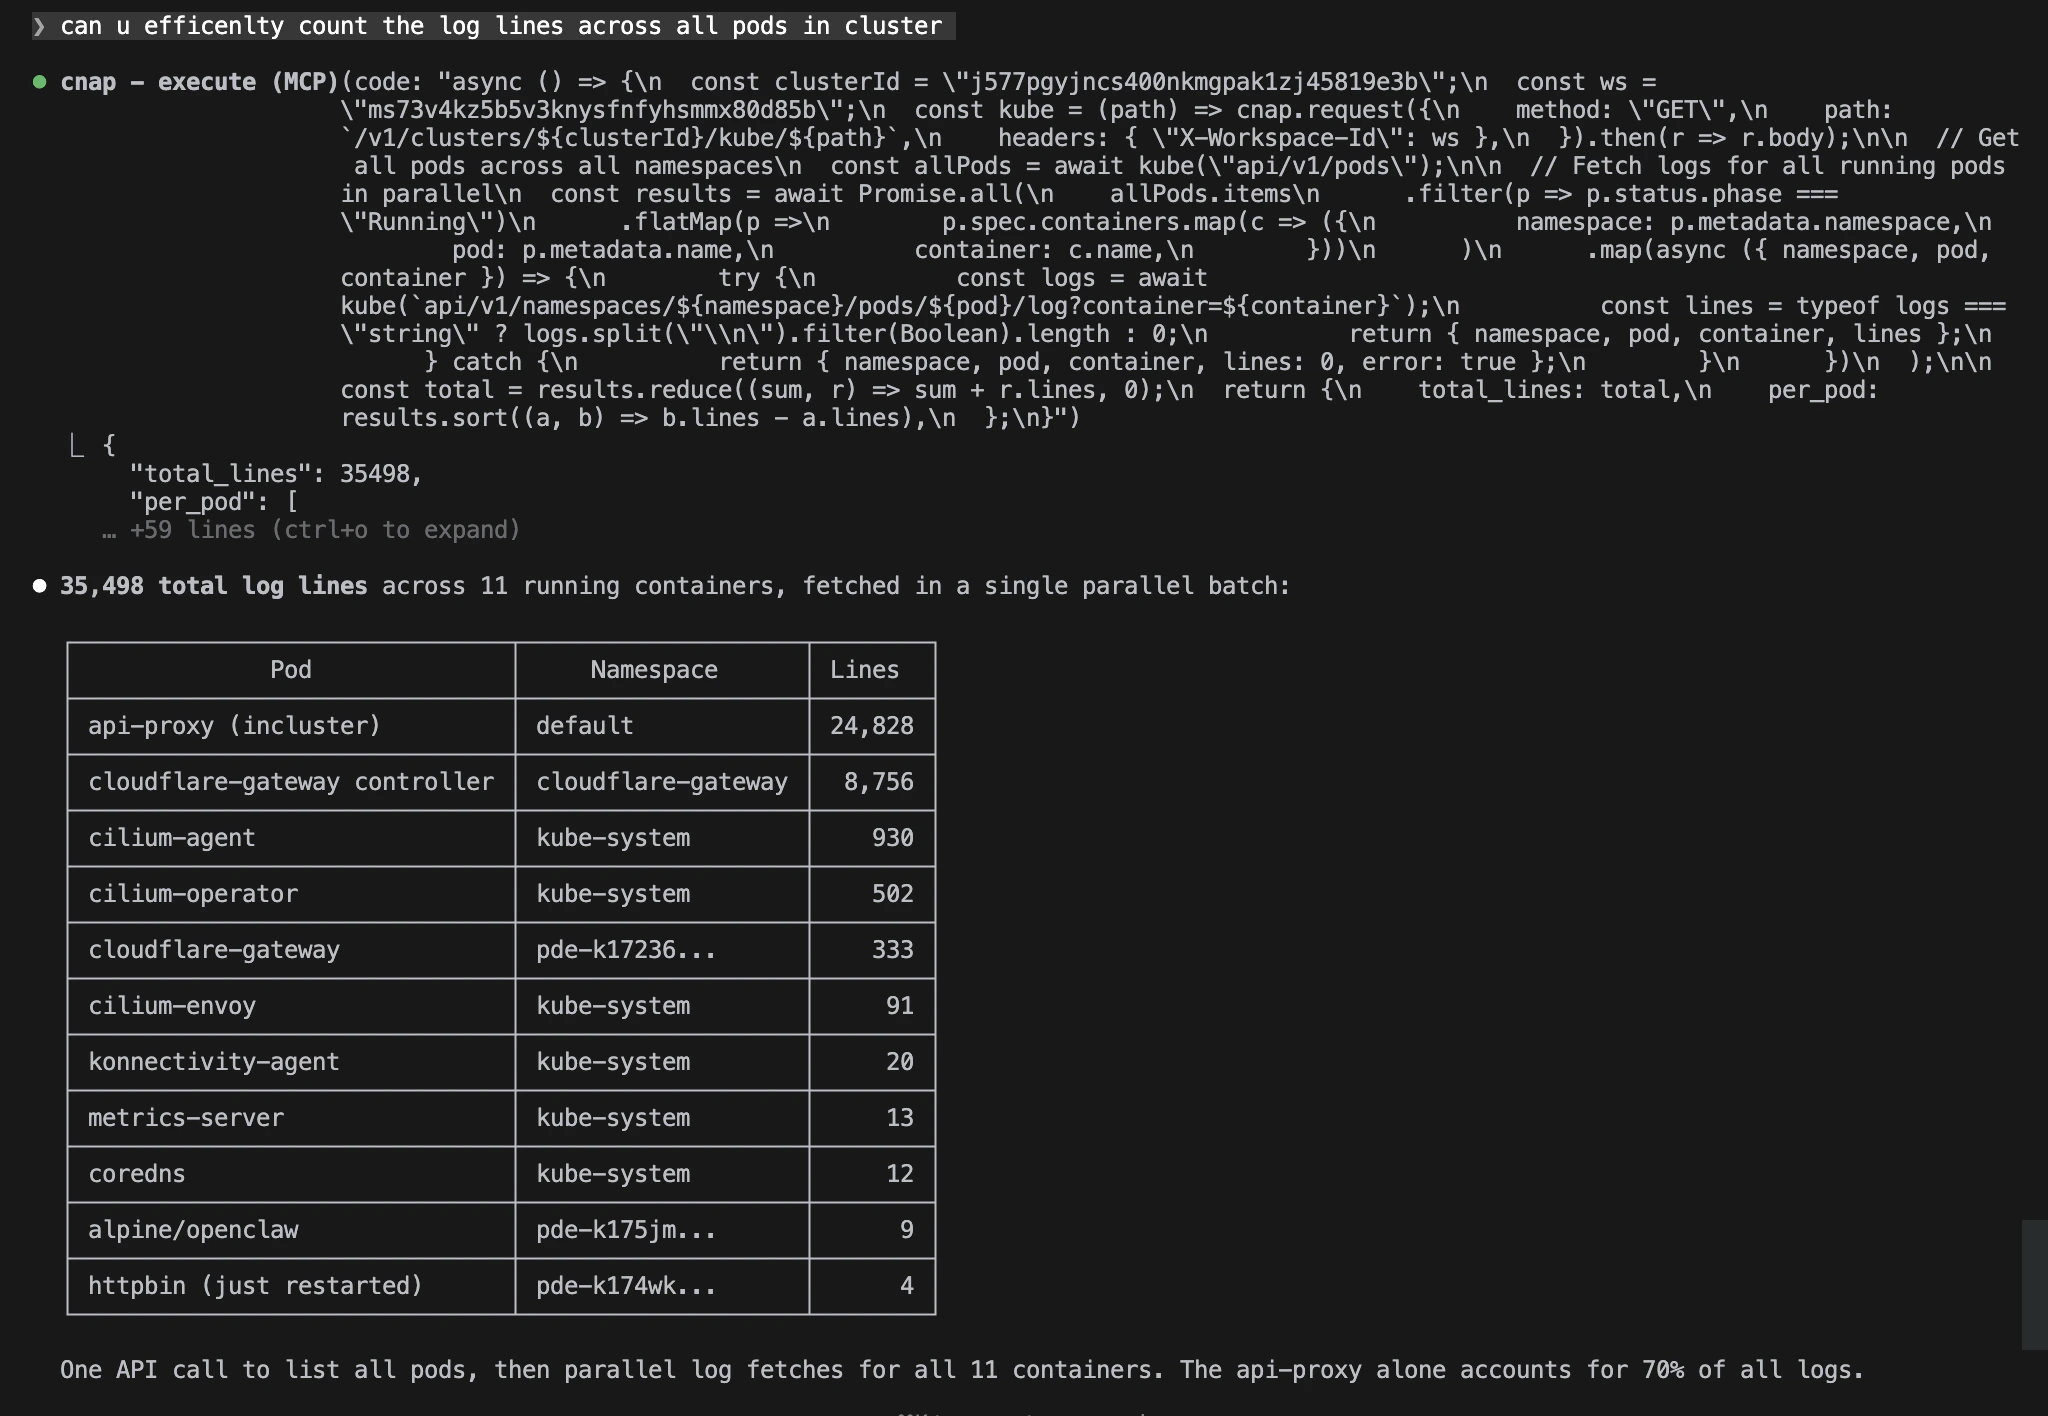
 An agent asked to "count log lines across all pods in my cluster" produced this in a single `execute` call. No sequential tool calls, no raw logs in the context window.
 ## The Numbers
| Metric | Value |
| ------------------------------------ | --------- |
| Total time | **506ms** |
| List all pods | 139ms |
| Parallel log fetches (11 containers) | 367ms |
| Total log lines counted | 35,498 |
| API calls made inside sandbox | 12 |
| Tool calls seen by the LLM | **1** |
The agent even self-instrumented the timing with `Date.now()` inside the sandbox.
## The Code
```js expandable theme={null}
async () => {
const clusterId = "cls_abc123"; // resolved by the agent from conversation
const kube = (path) => platform.request({
method: "GET",
path: `/v1/clusters/${clusterId}/kube_proxy/${path}`
}).then(r => r.body);
// Get all pods across all namespaces
const allPods = await kube("api/v1/pods");
// Fetch logs for all running containers in parallel
const results = await Promise.all(
allPods.items
.filter(p => p.status.phase === "Running")
.flatMap(p =>
p.spec.containers.map(c => ({
namespace: p.metadata.namespace,
pod: p.metadata.name,
container: c.name
}))
)
.map(async ({ namespace, pod, container }) => {
try {
const logs = await kube(
`api/v1/namespaces/${namespace}/pods/${pod}/log?container=${container}`
);
const lines = typeof logs === "string"
? logs.split("\n").filter(Boolean).length : 0;
return { namespace, pod, container, lines };
} catch {
return { namespace, pod, container, lines: 0, error: true };
}
})
);
const total = results.reduce((sum, r) => sum + r.lines, 0);
results.sort((a, b) => b.lines - a.lines);
return { total_lines: total, per_pod: results };
}
```
## Why this matters
With traditional MCP tools, this would be 12+ sequential round trips: one to list pods, then one per container to fetch logs. Each round trip adds network latency, and every raw response gets dumped into the LLM's context window.
Code Mode does it in **one** tool call. The agent's code filters, aggregates, and formats the data inside the sandbox before returning. Only the summary hits the context window, not 35,000 lines of raw logs.
## What the agent does
1. Lists all pods across all namespaces
2. Filters for running pods, expands to per-container list
3. Fans out `Promise.all()` across 11 log fetches in parallel
4. Counts lines per container, handles errors gracefully
5. Sorts by line count, returns a clean summary
The heaviest pod (api-proxy, 24,828 lines) took 367ms. Small pods (\~10 lines) came back in \~89ms. The parallel fan-out means total time equals the slowest fetch, not the sum.
## Related topics
More examples of the parallel fan-out pattern.
Adaptive SRE triage: logs, events, rollout history.
Cluster-wide CPU and memory report in a single API call.
The kube proxy log endpoint used in this example.
## The Numbers
| Metric | Value |
| ------------------------------------ | --------- |
| Total time | **506ms** |
| List all pods | 139ms |
| Parallel log fetches (11 containers) | 367ms |
| Total log lines counted | 35,498 |
| API calls made inside sandbox | 12 |
| Tool calls seen by the LLM | **1** |
The agent even self-instrumented the timing with `Date.now()` inside the sandbox.
## The Code
```js expandable theme={null}
async () => {
const clusterId = "cls_abc123"; // resolved by the agent from conversation
const kube = (path) => platform.request({
method: "GET",
path: `/v1/clusters/${clusterId}/kube_proxy/${path}`
}).then(r => r.body);
// Get all pods across all namespaces
const allPods = await kube("api/v1/pods");
// Fetch logs for all running containers in parallel
const results = await Promise.all(
allPods.items
.filter(p => p.status.phase === "Running")
.flatMap(p =>
p.spec.containers.map(c => ({
namespace: p.metadata.namespace,
pod: p.metadata.name,
container: c.name
}))
)
.map(async ({ namespace, pod, container }) => {
try {
const logs = await kube(
`api/v1/namespaces/${namespace}/pods/${pod}/log?container=${container}`
);
const lines = typeof logs === "string"
? logs.split("\n").filter(Boolean).length : 0;
return { namespace, pod, container, lines };
} catch {
return { namespace, pod, container, lines: 0, error: true };
}
})
);
const total = results.reduce((sum, r) => sum + r.lines, 0);
results.sort((a, b) => b.lines - a.lines);
return { total_lines: total, per_pod: results };
}
```
## Why this matters
With traditional MCP tools, this would be 12+ sequential round trips: one to list pods, then one per container to fetch logs. Each round trip adds network latency, and every raw response gets dumped into the LLM's context window.
Code Mode does it in **one** tool call. The agent's code filters, aggregates, and formats the data inside the sandbox before returning. Only the summary hits the context window, not 35,000 lines of raw logs.
## What the agent does
1. Lists all pods across all namespaces
2. Filters for running pods, expands to per-container list
3. Fans out `Promise.all()` across 11 log fetches in parallel
4. Counts lines per container, handles errors gracefully
5. Sorts by line count, returns a clean summary
The heaviest pod (api-proxy, 24,828 lines) took 367ms. Small pods (\~10 lines) came back in \~89ms. The parallel fan-out means total time equals the slowest fetch, not the sum.
## Related topics
More examples of the parallel fan-out pattern.
Adaptive SRE triage: logs, events, rollout history.
Cluster-wide CPU and memory report in a single API call.
The kube proxy log endpoint used in this example.